
Worked example
From objective to evidence
One objective followed through its owner, its KPI, a project that serves it and the evidence for one condition, on the fictional entity shown in our screenshots.
A plan in a deck, KPIs in a spreadsheet, projects in another system
The strategic plan is approved, but it lives in a slide deck. KPIs are updated in a spreadsheet that departments pass around by email. Projects are followed in the PMO's system, or in more spreadsheets. And before every measurement cycle a team is formed to collect evidence.
Each of these parts works. What does not work is the link between them: which project serves which objective, which KPI suffers if it slips, and which measurement condition it satisfies. The example below follows that link through one objective.
Four links, one objective
Raise beneficiary satisfaction with digital services
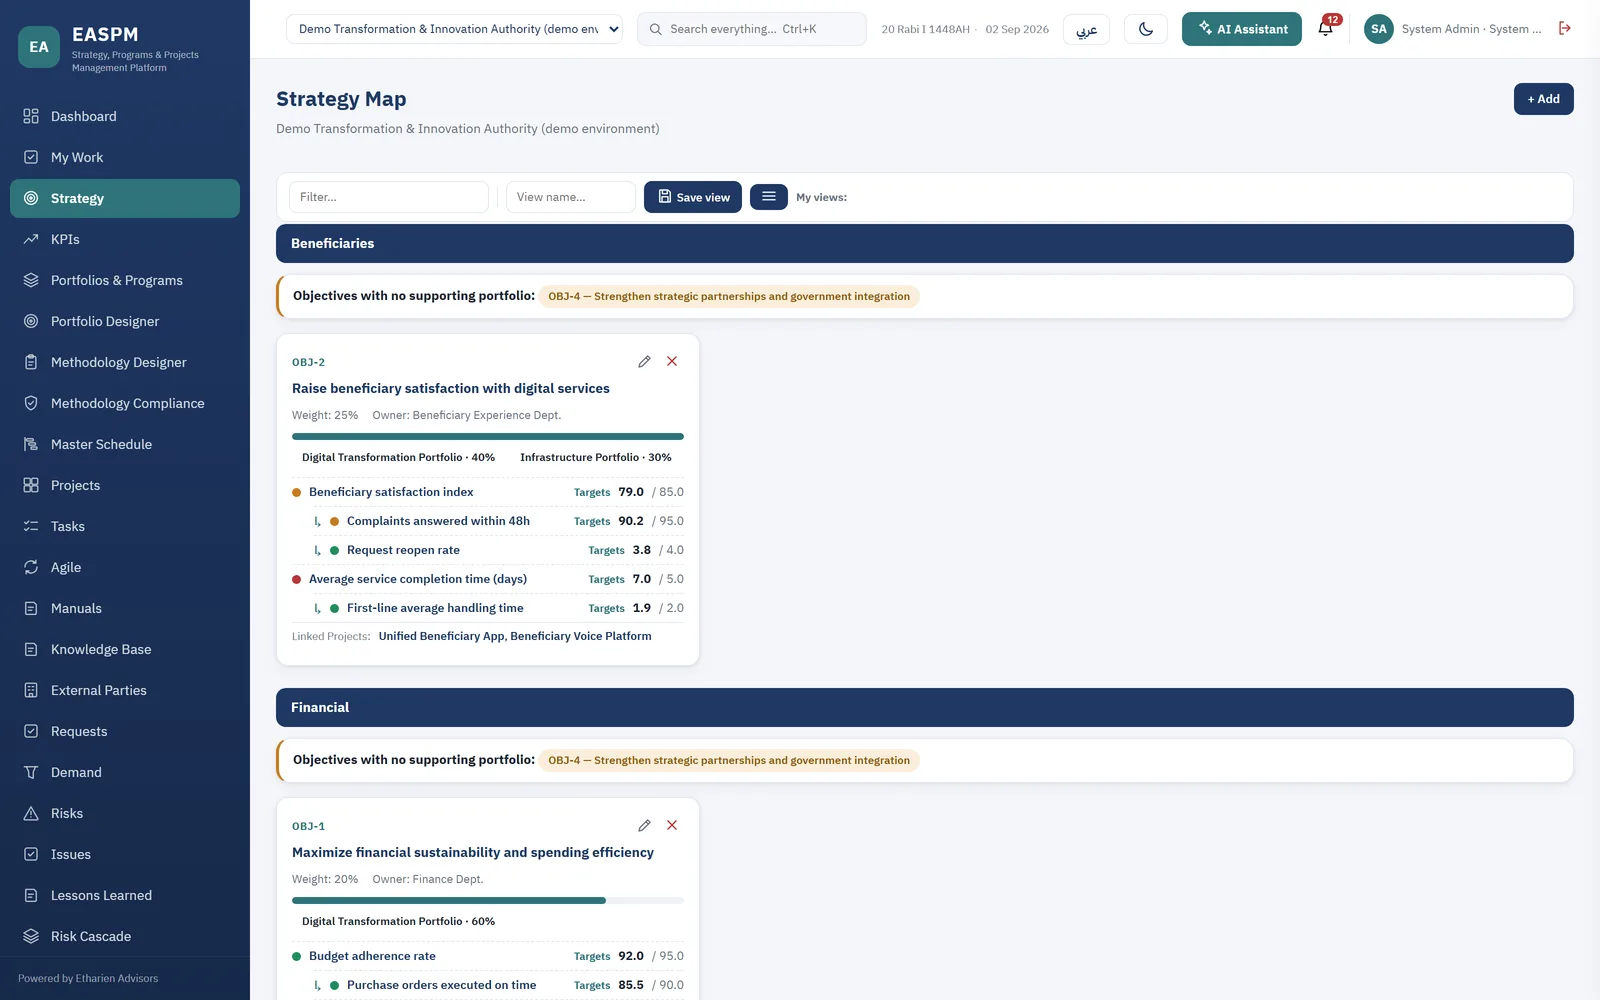
The objective is built inside the platform rather than pasted in as a picture. It has an owner, a weight, the KPIs that measure it, and the projects that serve it, all on the same card. The same screen lists any objective that has no supporting portfolio, so a gap in the plan is visible rather than discovered later.
- Objective
- OBJ-2, under the Beneficiaries perspective.
- Owner
- The Beneficiary Experience Dept.
- Weight in the plan
- 25%.
- Linked projects
- The Unified Beneficiary App and the Beneficiary Voice Platform.
Beneficiary satisfaction index
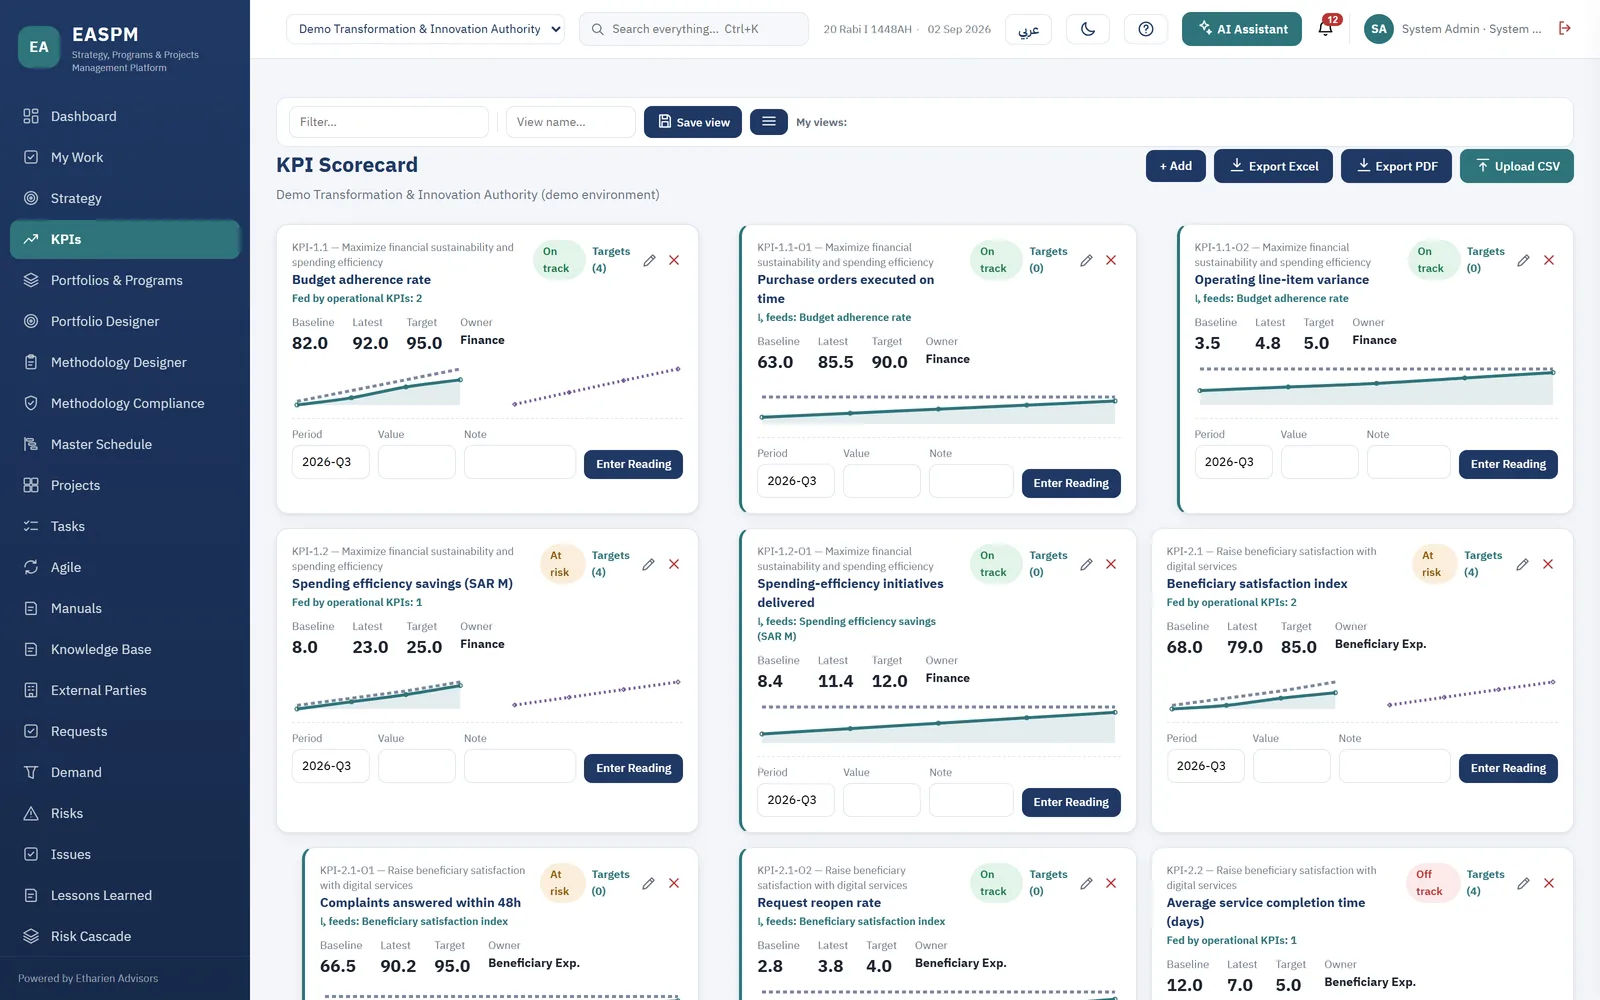
KPI-2.1 measures the objective. Its owner, baseline, target and history sit on one card, and the operational KPIs that feed it, such as complaints answered within 48 hours, roll up into it. The reading entered each quarter is the same number the leadership report shows, not a copy of it.
- Baseline
- 68.0.
- Latest reading
- 79.0.
- Target
- 85.0.
- Cycle
- Readings entered by quarter; the period open for entry is 2026-Q3.
- State
- At risk, and fed by two operational KPIs.
Unified Beneficiary App
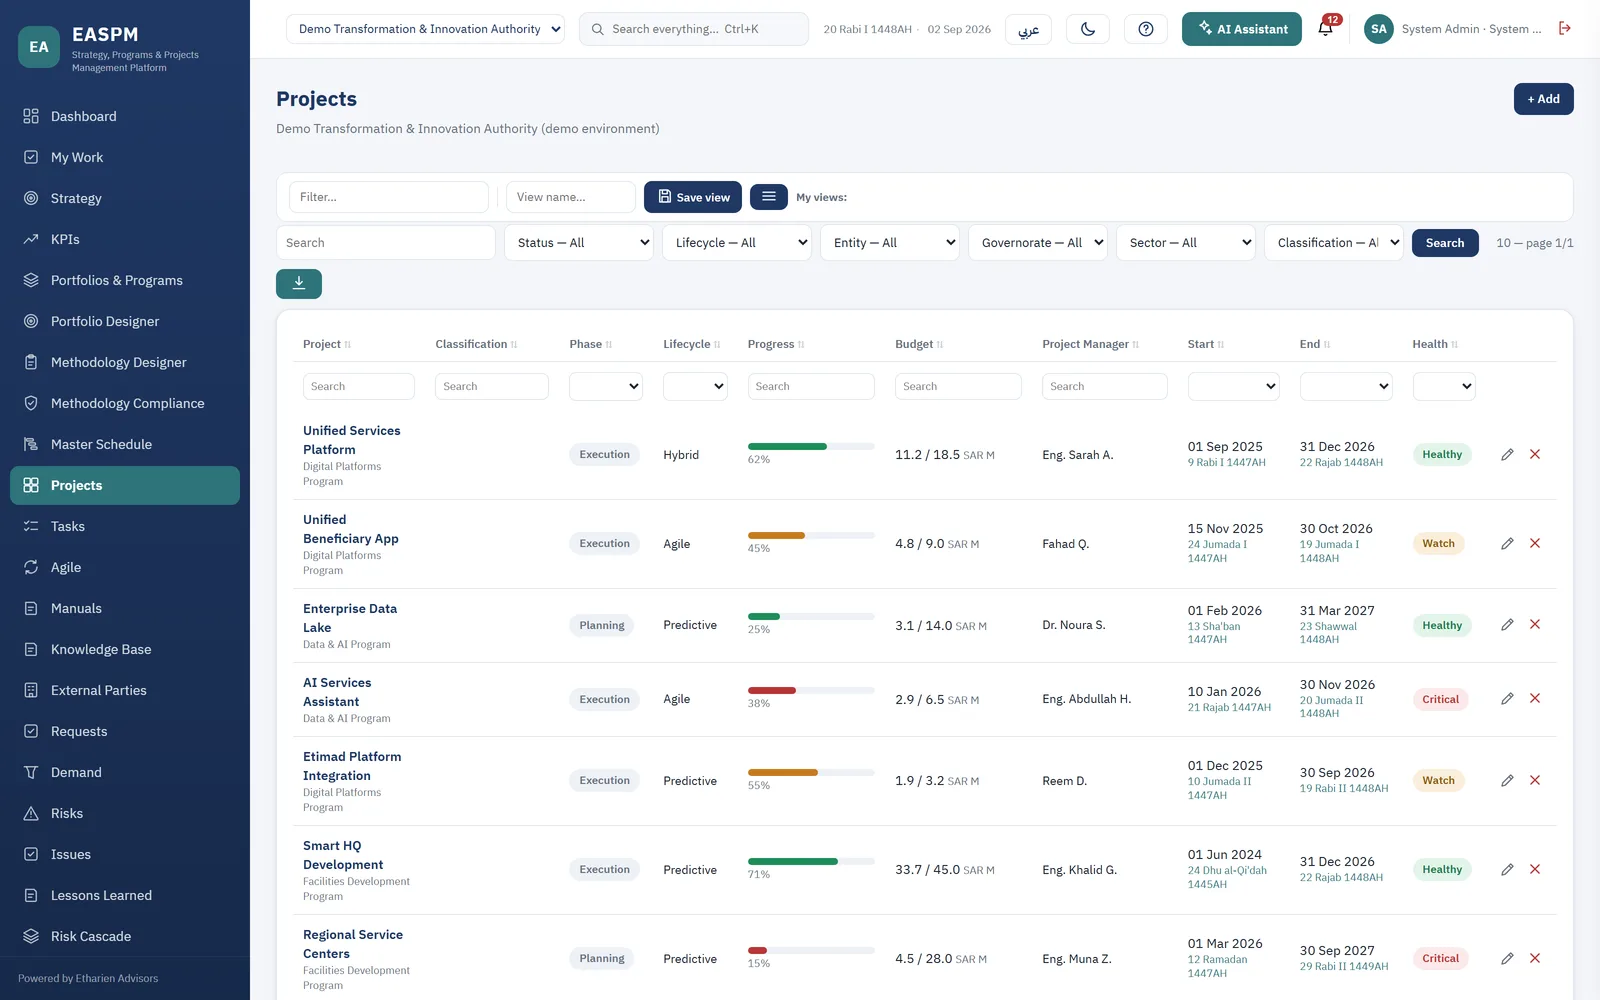
One of the projects linked to the objective. Because the project is linked to the KPI and the KPI to the objective, a slip here shows on the KPI and then on the objective, before anyone asks about it in the leadership meeting.
- Phase
- Execution.
- Lifecycle
- Agile.
- Progress
- 45%.
- Health
- Watch.
The condition, its evidence, and its state
The report is filed against the condition the day it is produced, not the day the file is requested. On any given day the condition is in one of three states, and the platform shows which:
It shows no predicted score and no predicted ranking.
- Condition (fictional)
- The authority measures beneficiary satisfaction every quarter and documents what it does with the result.
- Evidence
- The quarterly survey report, linked directly to the condition with its date and source.
- Owner
- The Beneficiary Experience Dept., the same owner as the objective.

Ask for the same trace on your scenario
Tell us in the demo request which objective matters to you. We show the chain on screen, from the objective to its KPI, to the project serving it, to the condition and the evidence, with fictional data of your entity type. Then ask every other vendor you are evaluating for the same trace.
How to compare platforms · Frameworks and readiness · Platform
See the chain on a scenario from your sector
Sixty minutes, a scenario from your sector, and a frank discussion of what fits and what does not.